Map Editor User Guide - Quick Start
|
Installation Feature LayerStyles Effects Drop Shadow |
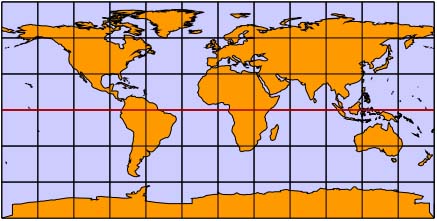
IntroductionThis chapter leads you through some of the basic map viewer operations, including opening a map, importing data, navigating round the map, exporting, printing and editing styles. You should run the map viewer and follow the steps in this chapter to familiarize ourself with how the Map Editor works. Opening a MapThe Map Editor comes with a sample map file "World.jmv" containing a map of the world. Open this file by choosing "Open..." from the file menu or clicking on the open button in the toolbar. You should see a map of the world, looking like this:
This is a map consisting of three layers: the blue background, the world coastline and the graticule. The coastline layer is loaded from an external file while the background and graticule are instances of custom layer types, NavigatingThere are many ways of navigating around the map. Here are a few to try: To zoom in, select the Zoom tool from the toolbox and click on a point to zoom the map around that point. To zoom out again, hold down the Control key while clicking. You can also drag a rectangle around an area you want to view. The viewer will zoom the map so that all the area you selected is visible and fits as well as possible to the window. You can also drag an area while holding down the Control key to zoom out (think of the window being shrunk onto the rectangle you drag).
The Zoom tool To recentre the map, use the Pan tool. Click on a point in the map and drag it to a new position. The view will update when you release the mouse button.
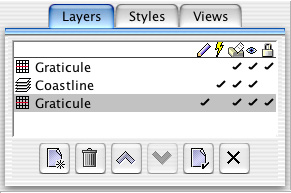
The Pan tool Editing LayersThe world map contains three layers: a frame which provides the blue background, the world coastline, and a graticule drawn over the top. To see the layer list, choose "Layers and Styles" from the View menu, or click on the toolbar button (picture). A panel will appear at the left of the window listing the layers:
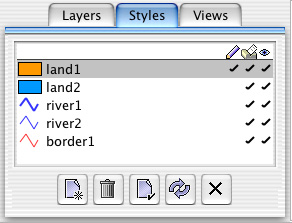
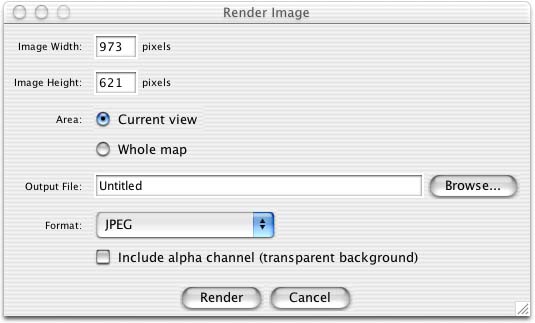
The Layers panel Try showing and hiding the layers by clicking in the "eye" column of the list. Now try adding a new layer: Press the "new" button and choose "World Places Layer" from the list shown, then press "OK". You should see labels showing many cities around the world appearing on the map (The World Places layer is an example of a special layer type which was written as an example of creating your own layer types). The new layer appears above the graticule, so press the "up" button to move it behind the graticule. Importing DataNow try importing some map data. Choose "Import..." from the File menu or press the toolbar button and choose the file "world-topo.jpg". This should import an image of world topography which will appear in a new layer hiding the rest of the map. Again, you can move the layer behind the others. Alternatively, select the new layer and press the "Edit" button which shows a dialog to edit the layer properties. Here you can rename the layer, or change its opacity so that the other layers can be seen through it. Changing StylesThe coastline in the world map is very orange. You can change it by changing the feature style attached to the coastline features. Show the Layers and Styles panel if it's not already visible and select the "Styles" tab: . The Styles Panel The coastline has the "land1" style. Select this style and press the "Edit" button. This will show a dialog allowing you to change the properties of the style, including the fill color, the line width and style and the font of any text as well as any symbols drawn. There are many plugins for things such as fill patterns, line styles and symbols which may affect the number and look of items in this dialog. Adding EffectsEffects can be added to layers in order to make your maps look more stylish. We'll add a drop shadow to the coastline layer to make the land stand out from the sea. Select the coastline layer in the layers panel and press the "Edit" button. When the dialog appears, select the "Effects" tab and press the "New" button to add an effect. A dialog will appear asking you what kind of effect you want to add: choose "Drop Shadow". The shadow effect dialog will now appear where you can change the settings on the shadow. For now, just press "OK" to accept the default settings. Finally, press "OK" in the layer dialog. The map should now draw with a drop shadow around the coastline. Rendering an ImageNow that your map is ready to be put on your web site, you need to render it into an image at the size you want. Choose "Render..." from the "File" menu. You should see this dialog:
The Render Dialog By default, it's set up to export an image at the size of your current view. Change the width to 300 pixels and the height to 150 pixels and then select "Whole map" as the area to render. Finally choose a filename and a format to export in and press "Render" to render the image. Some image formats support an alpha channel which is useful if you want a transparent background or translucent maps. You can turn on the alpha channel by selecting the "Include alpha channel" checkbox. ExportingNow you have a pretty map, you can save it in Map Editor's own file format or export it in other formats. Map Editor's own file format is text-based and easy to read, and in particular is easy to write so you can create maps by writing external scripts or programs.
|