Map Editor - Overview
|
Installation Feature LayerStyles Effects Drop Shadow |
MapsA map is the fundamental object displayed by Map Editor. A map consists of a number of layers, each of which may contain features - the visible objects in the map. A map also has a set of attributes such as the units and coordinate system it uses. Each map you are editing is displayed in its own window. LayersEach map can contain a number of layers which are displayed overlaid on each other. Typically you would have one layer for each theme or group of related features. Thus a world map might have a background layer showing the world coastline, a layer showing major cities and a layer with a graticule. Layers can be reordered or hidden from view using the map inspector. You can also change the opacity of layers to allow layers below to show through. It is also possible to add effects to layers after they are drawn. Layers can be created from the layer control panel or by importing from a file. When you import a file, you will usually (depending on the file format) get a new layer to hold the layer data. Saving such a layer will save a reference to the file it was imported from rather than saving the data itself. You can "break" the reference by taking the layer off-line, in which case the data will be saved with your map and you will be able to edit it. There are several types of layer:
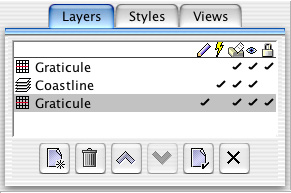
Working with LayersLayers are manipulated in the layer control panel which appears at the left of the map window. This can be shown or hidden by clicking on the toolbar button or by invoking the "Map Inspector" menu item. The layer control panel shows a list of the layers in the map with the backmost layer at the top of the list. To the right are five columns of ticks showing properties of each layer. You can click on these ticks to change the properties.
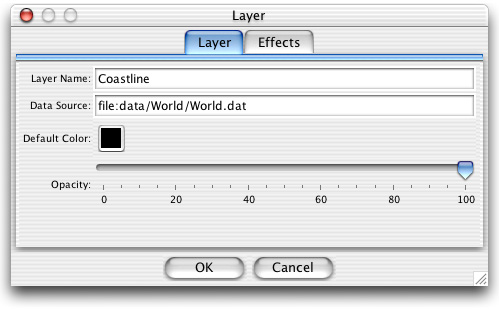
The layers panel At any time one layer, called the "active layer" is active for drawing or selecting. To set the active layer, just click on it in the layer control panel. The pencil icon indicates the active layer. The eye icon indicates whether the layer is visible or not. You may want to hide layers to make your maps clearer while you're working on them or to make them draw faster. The printer icon indicates whether the layer is printable. If unchecked, the layer won't be printed. You can lock layers to prevent them from being edited. This is indicated by the padlock icon. Finally, the "flash" icon indicates whether a layer is "live" or not. This only applies to layers which have a dynamic data source, such as a vector server. When a layer is live, features are fetched from the server as you pan and zoom round the map. These features can't be edited as they disappear when they go out of view, and won't be saved in save files. You can turn off the live layer behaviour by unchecking this column. When you do this, the current set of visible features will be frozen and you will be able to edit or save them. When you change view, however, no new features will become visible from the data source. You can make the layer live again at any time by checking this column again. Editing a LayerIn order to change the properties of a layer you can double-click on it in the layer list or press the "Edit" button. This displays the layer properties dialog which looks like this:
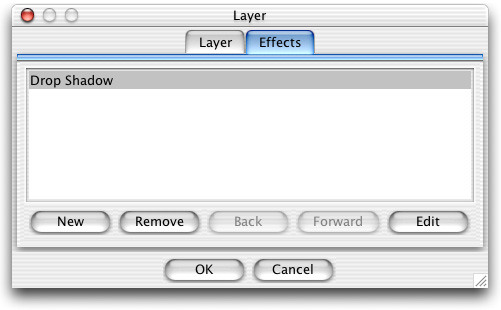
The layer editing dialog The "General" tab contains properties common to all types of layer and always exists whereas the other tabs will depend on the type of layer and the installed plugins. The name of the layer is a name which you give to it and which is displayed in the layers panel. The "data source" represents the source of the data to be displayed in the layer if the layer has a dynamic source. This is a URL which points to the file containing the layer data. You can change the opacity of a layer using the opacity slider. This is useful for showing backgrounds through images or contour plots. EffectsAfter a layer is painted, image-processing operations can be applied to it in order to add special effects. From the "Effects" tab in the layer editing dialog, you can add, remove and reorder effects as well as set the parameters of the effects. The "Effects" tab is only visible if any effects are installed. Typical effects include blurring, sharpening, drop shadows and adding lighting.
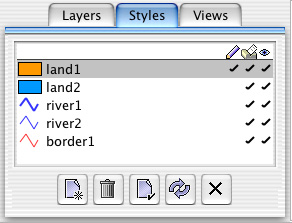
The Layer Effects dialog FeaturesA feature is an object displayed on a map. Each feature has an associated geometry which may be a point, path or polygon. A feature also has a feature style which indicates how it is drawn. There are several types of feature: Point FeatureA point feature consists of a single point, usually drawn with a symbol. An example would be a small town or a lighthouse, Symbols can be drawn at different scales or rotated. Path FeatureA path feature consists of a series of points connected together. Paths can include straight lines or quadratic Bezier curves and can consist of multiple disconnected segments, A path can be closed to create a polygon feature which may contain holes, Text FeatureA text feature simply draws a piece of text. Text can be drawn relative to a point or drawn along a path as well as being scaled or rotated. Image FeatureAn image feature displays an image, such as a scanned map or digital elevation model. Images can be warped to match the current projection. Grid featureA grid feature displays a rectangular grid where each cell can be coloured to indicate a value. It can also display contours for the grid values. Other FeaturesAdditional feature types can be added as plugins - for example, map furniture such as scalebars, north arrows etc. Features vs LayersWhy is there both an image feature and an image layer, as well as a grid feature and a grid layer? Layers are supposed to represent things which may have indefinite extent or at least be very large such as backgrounds, whereas features are localized objects which you can place on the map. In some cases these concepts may overlap and you should use whichever best fits your needs. GeometryEvery feature in a map has an associated geometry which defines its shape. This may be a point, a path or a polygon. Different types of feature may be attached to different geometries which may change their behaviour. For example, a point feature such as a lighthouse would have point geometry, but it is also possible to attach point features to paths which causes each point in the path to display the point symbol. Similarly, text is usually a point feature, but can be attached to a path in which case it will follow the shape of the path. Polygons are simply paths which are treated as being closed. Paths may include multiple disconnected segments and corner or quadratic Bezier control points. It is possible for more than one feature to share the same geometry. Moving one feature then causes the other to move with it. Feature StylesA feature style specifies how a feature is to be drawn. The style includes the linestyle, line and fill colours and text font and size. Styles are listed in the styles control panel at the left of the map window.
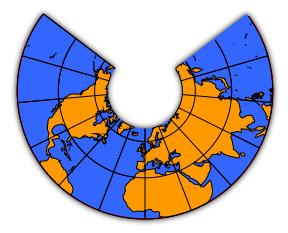
The Styles panel A style has a name which can be used to refer to it, allowing layers to look up styles from libraries. A style can be made visible and printable allowing different sets of features to be displayed for screen and printing. There is always a current style, shown by the pencil icon in the styles list. This is used as the style for all features which you draw with the editing tools. You can also assign a the selected style to features by selecting the features and pressing the "Assign" button. At present, Map Editor has no built-in support for thematic mapping, but it is possible to do this by creating styles for each value you want to display and then assigning the styles to features using the scripting language. AttributesFeatures may have attributes attached, such as population for cities or altitude for points. The attributes are defined by an attribute data source attached to the layer. The most common such source is a tabular data source where each feature in the layer has the same set of attributes and the layer can thus be displayed in tabular form, one row for each feature with the attribute values as the columns. It is also possible to have layers where each feature may have a different set of attributes. At present Map Editor makes no direct use of attributes, but it is possible to use the scripting language to perform tasks such as labelling features with their attribute values or to assign styles according to attributes. ProjectionsProjections are used to draw the Earth's surface on a plane. When the map's coordinates system is latitude/longitude, you can set a viewing projection in order to view your map with minumum (or maximum) distortion. Projections also form the basis of coordinate systems. Built in projections include Transverse Mercator, Lambert Conformal Conic and Plate Carrée, but many other projections are available as plugins.
The Lambert Conformal Conic Projection Coordinate SystemsA coordinate system is the method used to describe locations on a map. Examples are latitude/longitude for points on the Earth's surface or the State Plane coordinate systems used in the US. Map Editor supports and can convert between hundreds of different coordinate systems which are in common use. A map has three coordinate systems: the base system, the display system and the input system. The base coordinate system is the system in which the map's features are stored. Coordinates are displayed in the display coordinate system and you enter coordinates in the input coordinate system. Often these will all be the same, but you may find situations where it is useful to enter coordinates in a different system. As an example, your maps may use the New York State Plane coordinate system but you want to find locations which are specified in latitude/longitude. New coordinate systems can be added as plugins, or you can derive your own. Currently supported coordinate systems include:
In the future, individual layers will be able to have their own coordinate system. Import and ExportTypically vector or raster layers are created by importing data from a file or URL. Other special purpose layers have their own means of fetching map data.A layer can reference the file so that the file is reloaded every time the map is opened, or the data can be loaded once from the file and then saved with the map. If a layer references the file, the layer can be reloaded at any time so that you can see changes if you have changed the file or if the file is actually a dynamic URL such as a satellite weather image which is being constantly updated. As an example, suppose you want the current weather satellite image to be displayed as the background for your map. You can import the URL of the weather image by reference which will create a layer with the image in it. This image will be reloaded every time you open the map. Map Editor understands very few file formats by default: just its native format and GIF/JPEG images. Any other file formats are provided by plugins. Current plugins include DEM, E00, Shapefile, CSV, DXF, and many image formats such as TIFF. More will be added as time and inclination allows. In addition, the map viewer save file consists of a simple text format which is designed to be suitable for easy editing or creation by scripts.You can therefore write scripts to convert other file formats or to create map features. ScriptingMap Editor has a Java-like scripting language (using BeanShell). This allows you to create new toolbar/menu items, drawing tools and handlers for various sorts of event. There's also a mini-script editor for creating scripts on the fly. If you come up with a good script, you can fairly simply just convert it into real Java and compile it as a plugin for better performance. |